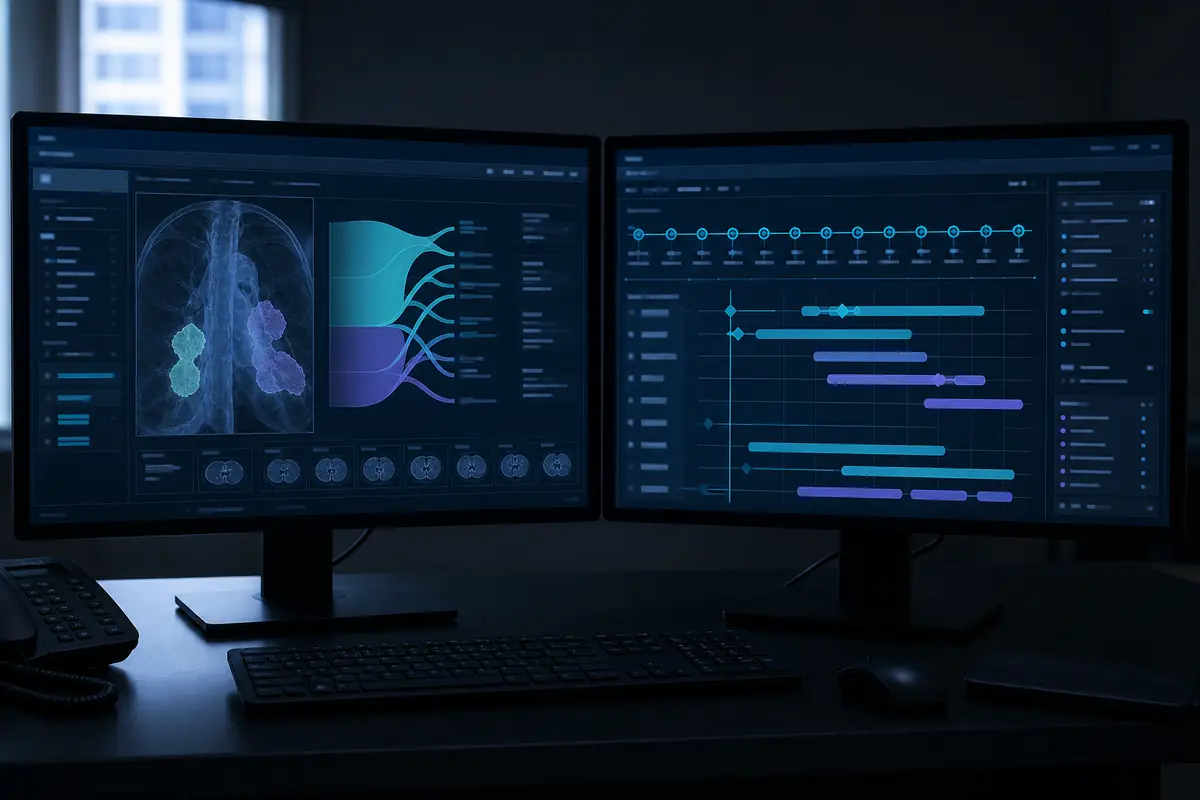
Oncology Centers

Connect screening, assessment, and follow-up with AI

Explainable multimodal Risk Stratification and tumor board preparation embedded in your existing clinical pathway.

S-02-02

Industry pain points

Five common bottlenecks Oncology Centers face under fragmented information and high-volume clinical assessment.

S-02-03

Solution mapping

Pain points, Neurovia capabilities, and customer outcomes aligned one to one.

Pain point Solution Customer outcome
Early screening misses Screening and follow-up Risk Stratification with automatic tumor board preparation queueing Highly suspicious cases surfaced sooner
Fragmented information Multimodal Fusion engine consolidates imaging / pathology / omics evidence Tumor board preparation time significantly reduced
Follow-up hard to track Follow-up window risk re-assessment and structured summaries Recurrence monitoring more continuous and auditable
Conclusions hard to explain Feature contribution, confidence intervals, and QC audit trails Supports teaching, QC, and compliance review
High replacement cost Standard DICOM / HL7 / FHIR integration with on-premises deployment Pilot embedding achievable in 4–8 weeks

S-02-04

Typical use cases

From daily screening to tumor board preparation—covering high-frequency Oncology Center workflows.

Scenario 01

Screening priority queue

Same-day screening and follow-up cases are automatically stratified by risk. Highly suspicious cases are prioritized to oncology specialists and the tumor board preparation list, reducing manual case identification.
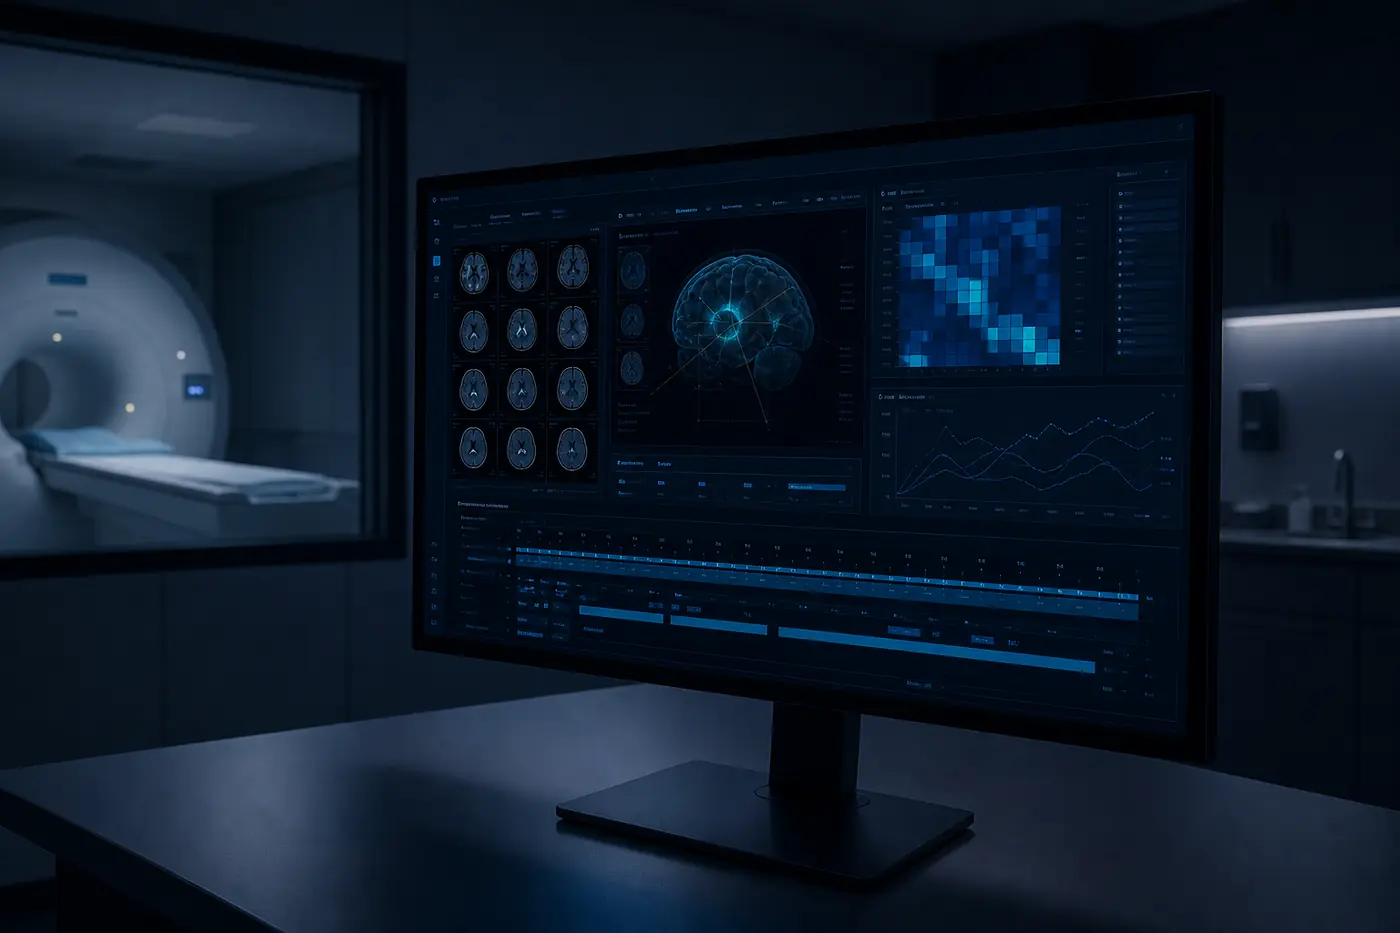
Risk Stratification workstation illustration
Workflow illustration · Risk Stratification workstation

Scenario 02

Tumor board evidence package generation

Before consultation, key imaging slices, pathology conclusions, and omics signals are consolidated into an auditable structured summary for multidisciplinary discussion.

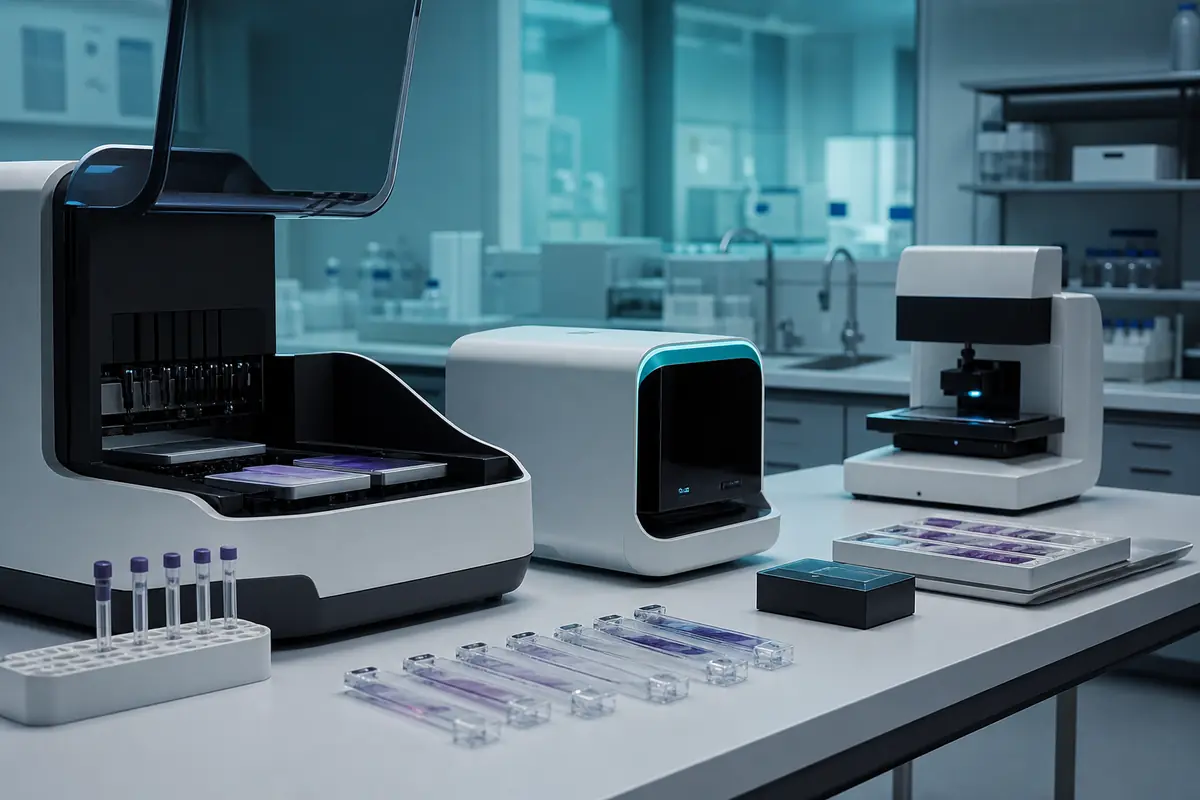
Multimodal Fusion input illustration
Workflow illustration · Multimodal evidence consolidation

Scenario 03

Follow-up risk re-assessment

Post-treatment follow-up milestones trigger dynamic re-stratification. Abnormal changes enter the review queue with a complete decision trail for QC spot checks.

Follow-up risk re-assessment illustration
Workflow illustration · Follow-up risk monitoring

S-02-05

Expected quantified outcomes

Typical results from pilot institutions (varies by data quality and workflow maturity).

35% Reduction in tumor board preparation time
28% High-risk cases reach specialist review sooner
4–8 weeks On-premises pilot integration completed

Tumor board preparation time breakdown (illustrative)

Pre-pilot
Post-pilot
Data gathering Summary preparation Consultation coordination

Reductions come mainly from data gathering and summary preparation; consultation coordination changes less.

AI pathway coverage ramp

35%
Week 2
62%
Week 4
88%
Week 8

Share of screening / follow-up cases entering the standard clinical workflow rises as calibration progresses.

S-02-06

Related Case Studies

Published cases in this industry and upcoming content.

Request an Oncology Centers solution consultation

Receive an industry whitepaper outline, data checklist, and 30-day pilot path.